AAPI at LaGuardia Community College (https://lagccaapi.github.io)
Overview
At LaGuardia Community College, a few AAPI-focused initiatives and groups have been created to foster a sense of support, empowerment, and belonging for all AAPI students, faculty, and staff within our college community. We recognize the unique experiences, challenges, and achievements of individuals with AAPI heritage, and aim to create a space where we can come together to celebrate our diverse cultures, share our stories, and advocate for inclusivity and equality. We invite all college community to join us and be a part of this vibrant and inclusive community. Together, we can make a positive impact on campus and beyond.
AAFSA and AAPI Heritage Month are the two major projects are currently ongoing at LaGuardia Community College. AAFSA (Asian American Faculty & Staff Association) is an affinity group that specifically focuses on individuals who identify themselves as AAPI. Its goal is to create a platform to discuss the unique contributions and needs of AAPI individuals. The other project is the planning committee for AAPI Heritage Month, which takes place in May. During May every year, LaGuardia welcomes the entire college community to participate in events, lectures, and food samplings to showcase the vibrant Asian and Asian American cultural diversity at our college campus.
Outside of the institution, LaGuardia actively participates in the AAARI (Asian American/Asian Research Institute; https://aaari.info ). The AAARI provides resources, research, and platforms for Asian American and Asian diaspora studies. LaGuardia's involvement with AAARI allows for cross-collaboration and the sharing of knowledge, further enriching the understanding and experience of the AAPI community within the college community.
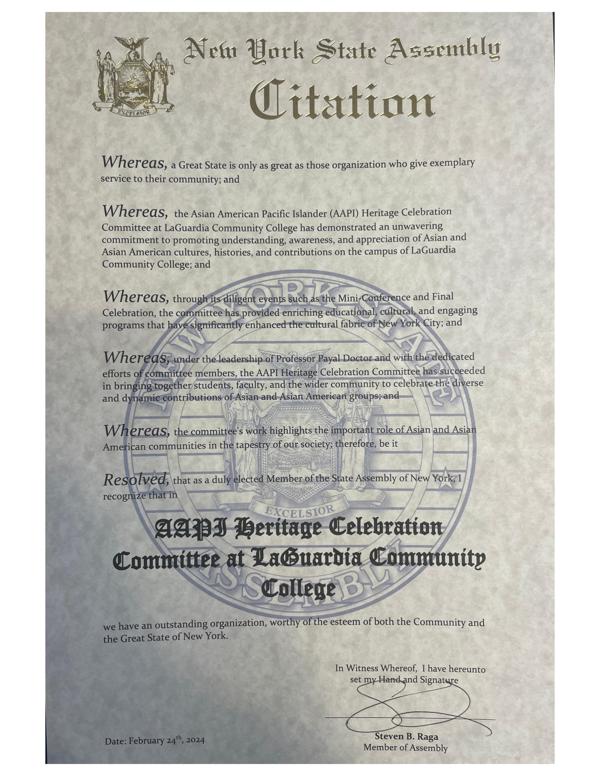
[Update on Monday, February 26, 2024] Assembly Member Steve Raga has issued a citation for the AAPI Heritage Committee for our dedication to spreading awareness of Asian/Asian American heritage and cultures.
Resources and links for the AAPI initiatives
AAARI
Assembly Member Steve Raga's citation for the AAPI Heritage Committee on 2/24/2024
AAFSA
AAFSA (Asian American Faculty & Staff Association) is an affinity group that focuses on individuals who identify themselves as AAPI. This affinity group models its sister organization at Brooklyn College (https://linktr.ee/BCAsianAmericanFSA ). Any faculty and staff member who identifies themselves as an AAPI individual is welcome to join the AAFSA at LaGuardia Community College.
The mission statement of the AAFSA (Asian American Faculty & Staff Association):
Founded in 2020, the Asian American/Asian Faculty & Staff Association (AAFSA) at LaGuardia Community College is dedicated to addressing topics relevant to the Asian American and Pacific Islander (AAPI) community at the college. Our goals include, but are not limited to, recognizing AAPI identities, learning about the histories and contributions of AAPI individuals, and establishing an equitable work environment for the AAPI community at LaGuardia. The current priorities of AAFSA focus on fostering dialogue to cultivate an inclusive work environment, building coalitions among AAPI individuals at LaGuardia and beyond, and developing the Asian American Studies curriculum at LaGuardia.
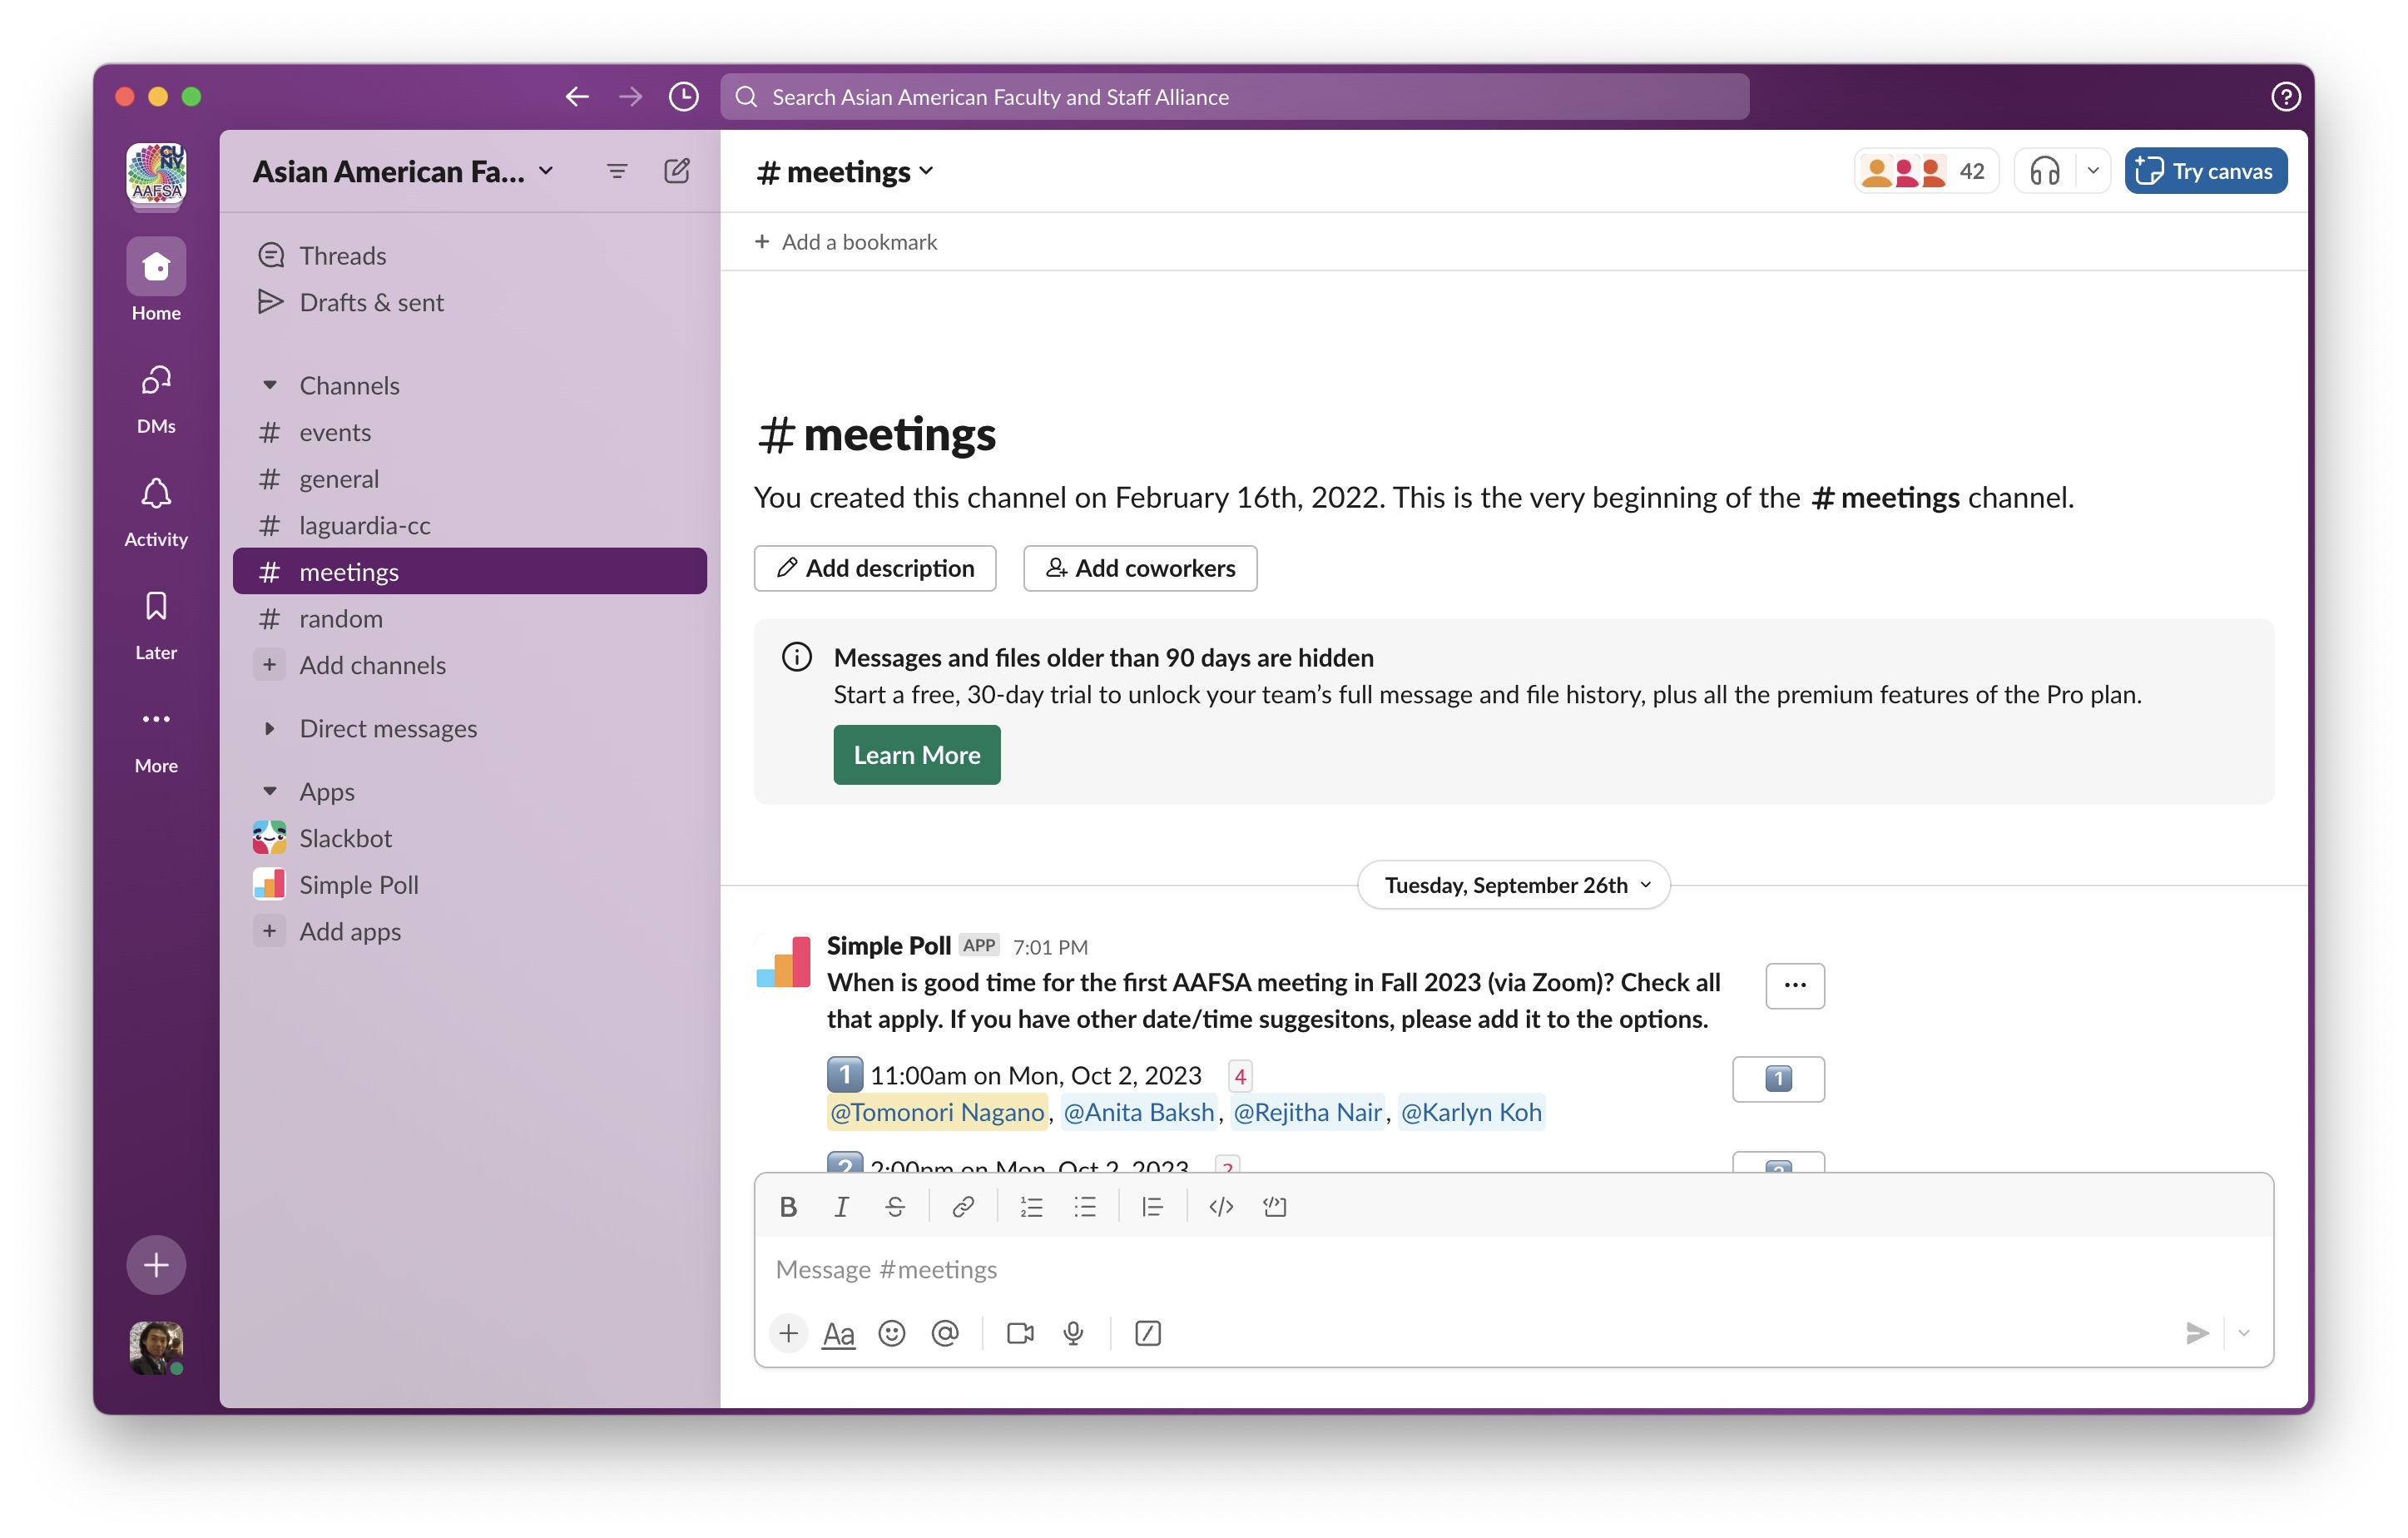
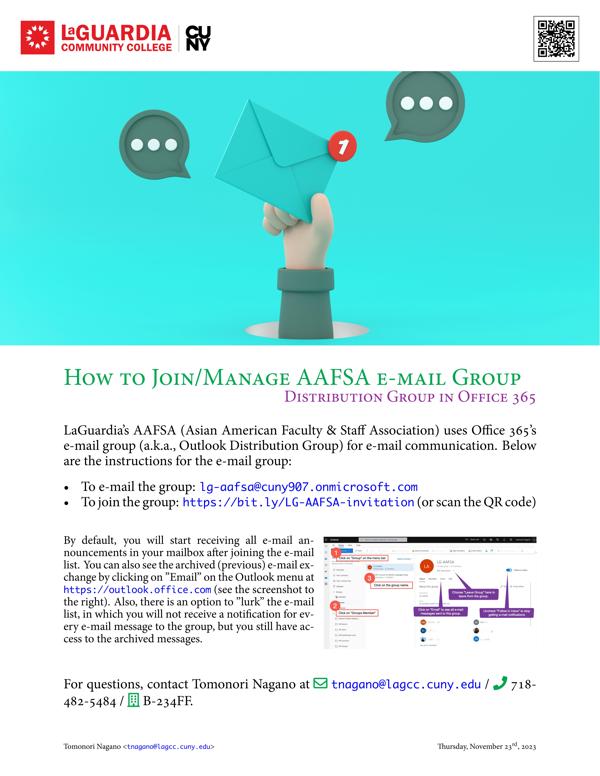
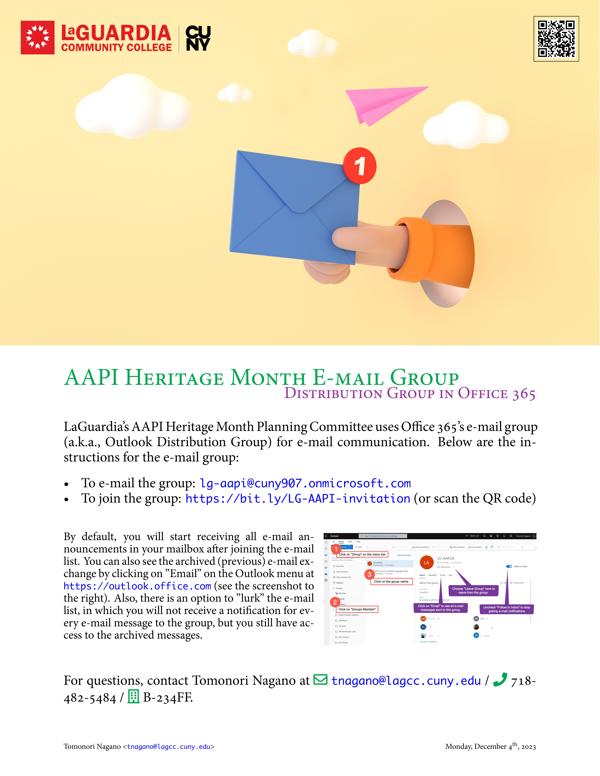
AAFSA regularly hosts virtual meetings (about 3-4 times per semester) and has active online discussions on Slack (https://asianamerican-cuny.slack.com ). AAFSA also has an Outlook Distribution Group (email list) with which we share information as needed (see the flyer below for more info). See information below if you are interested in joining the AAFSA Slack and/or e-mail group.
How to join the AAFSA
Any faculty and staff member who identifies themselves as an AAPI individual is welcome to join the AAFSA at LaGuardia Community College.
- E-mail to lg-aafsa@cuny907.onmicrosoft.com to send a message to the AAFSA
- Click this link to join the Outlook e-mail distribution group for the AAFSA: https://bit.ly/LG-AAFSA-invitation
- Slack: https://asianamerican-cuny.slack.com
AAFSA Slack
AAFSA e-mail list
AAPI Heritage Month
Every year, a planning committee comprised of AAPI and non-AAPI faculty, staff, and students is formed to celebrate AAPI Heritage Month in May. The planning committee organize events, secure funds, and execute the planned events to celebrate the AAPI heritage at LaGuardia Community College in May.
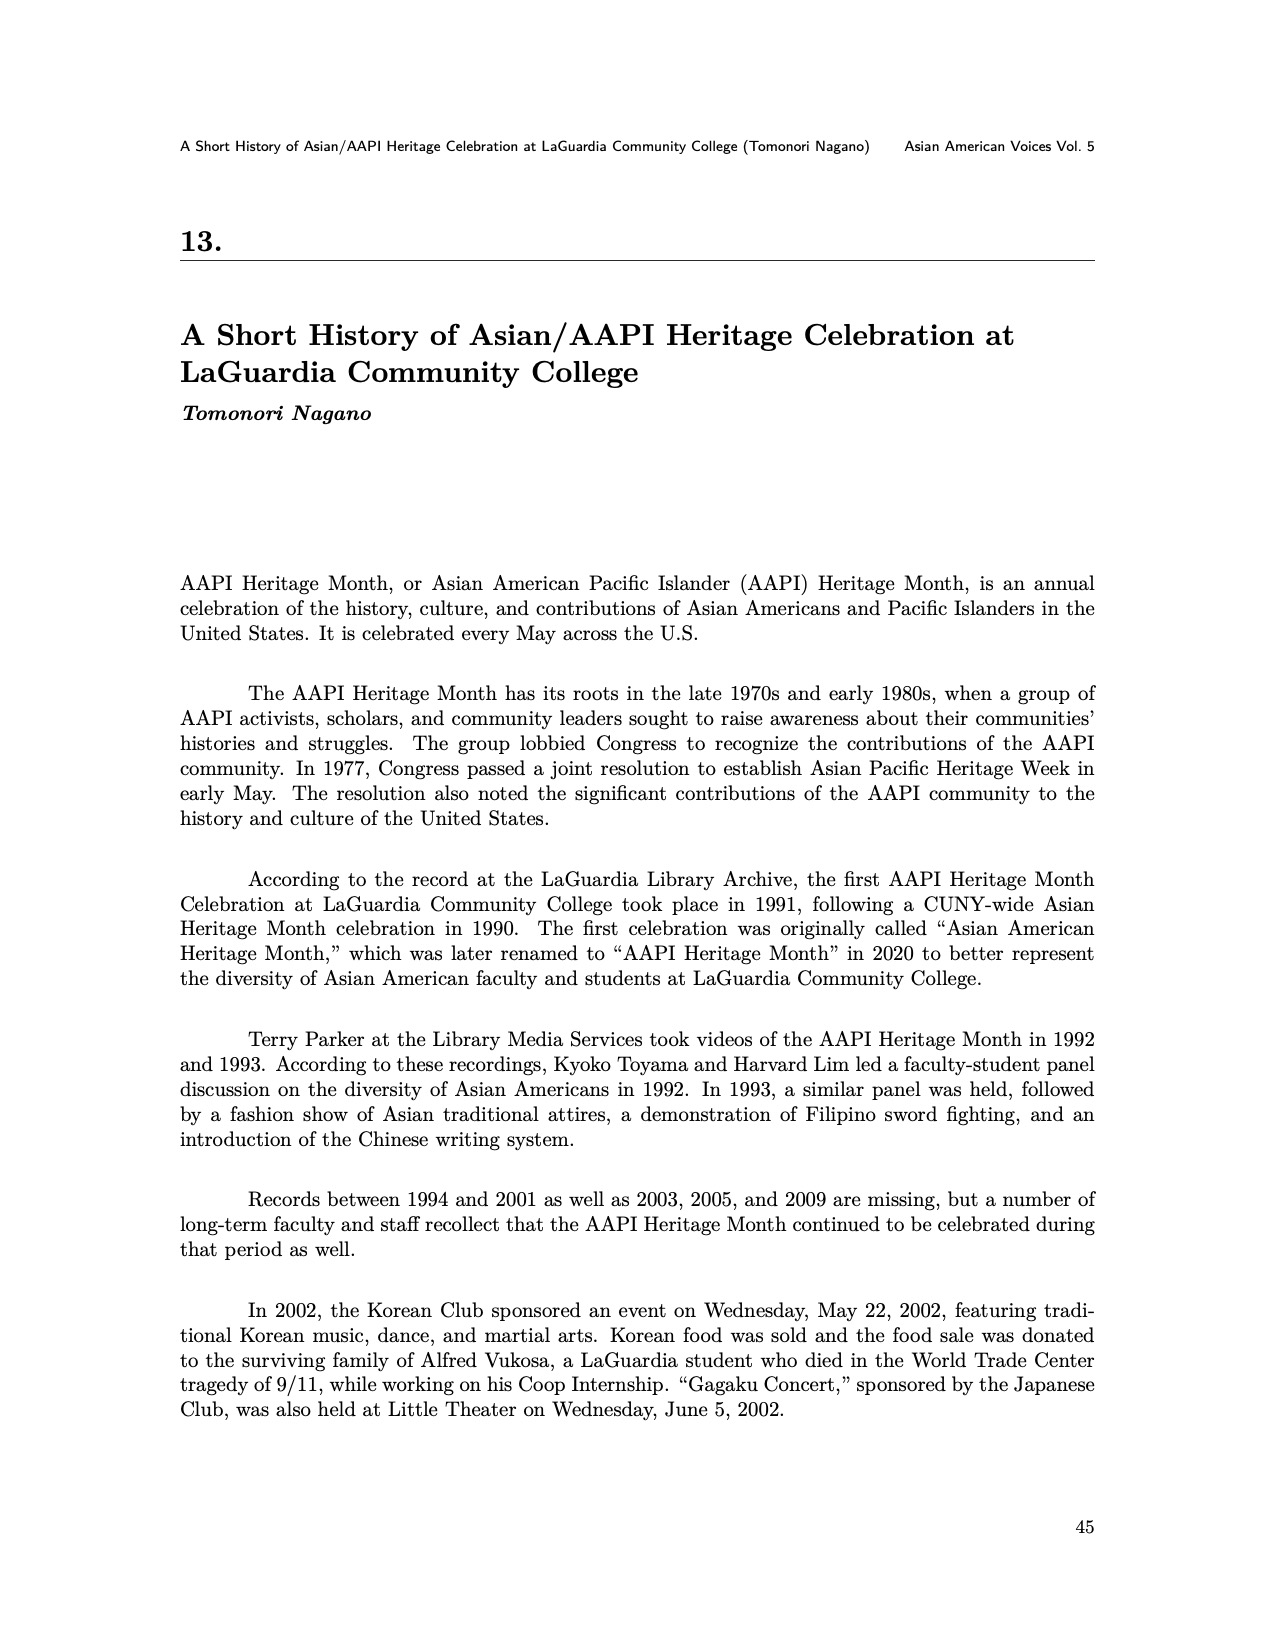
The AAPI Heritage Month has its roots in the late 1970s and early 1980s, when a group of AAPI activists, scholars, and community leaders sought to raise awareness about their communities’ histories and struggles. The group lobbied Congress to recognize the contributions of the AAPI community. In 1977, Congress passed a joint resolution to establish Asian Pacific Heritage Week in early May. The resolution also noted the significant contributions of the AAPI community to the history and culture of the United States. The first AAPI Heritage Month Celebration at LaGuardia Community College took place in 1991, following a CUNY-wide Asian Heritage Month celebration in 1990. The first celebration was originally called “Asian American Heritage Month,” which was later renamed to “AAPI Heritage Month” in 2020 to better represent the diversity of Asian American faculty and students at LaGuardia Community College.
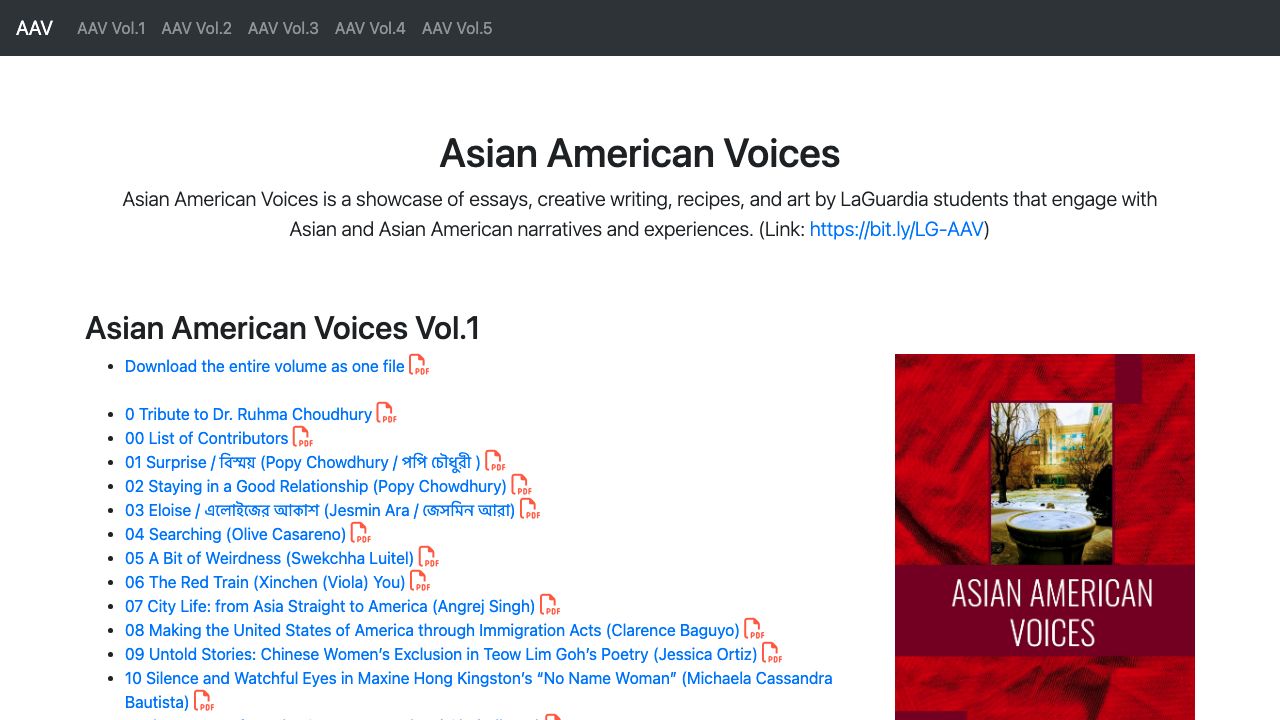
Starting in 2019, a sub-committee to publish collected essays, poems, photos, drawings, and other forms of art work by AAPI students. The sub-committee calls for student submission to publish the "Asian American Voices" (https://bit.ly/LG-AAV ) journal every May.
Resources and links for AAPI Heritage Month
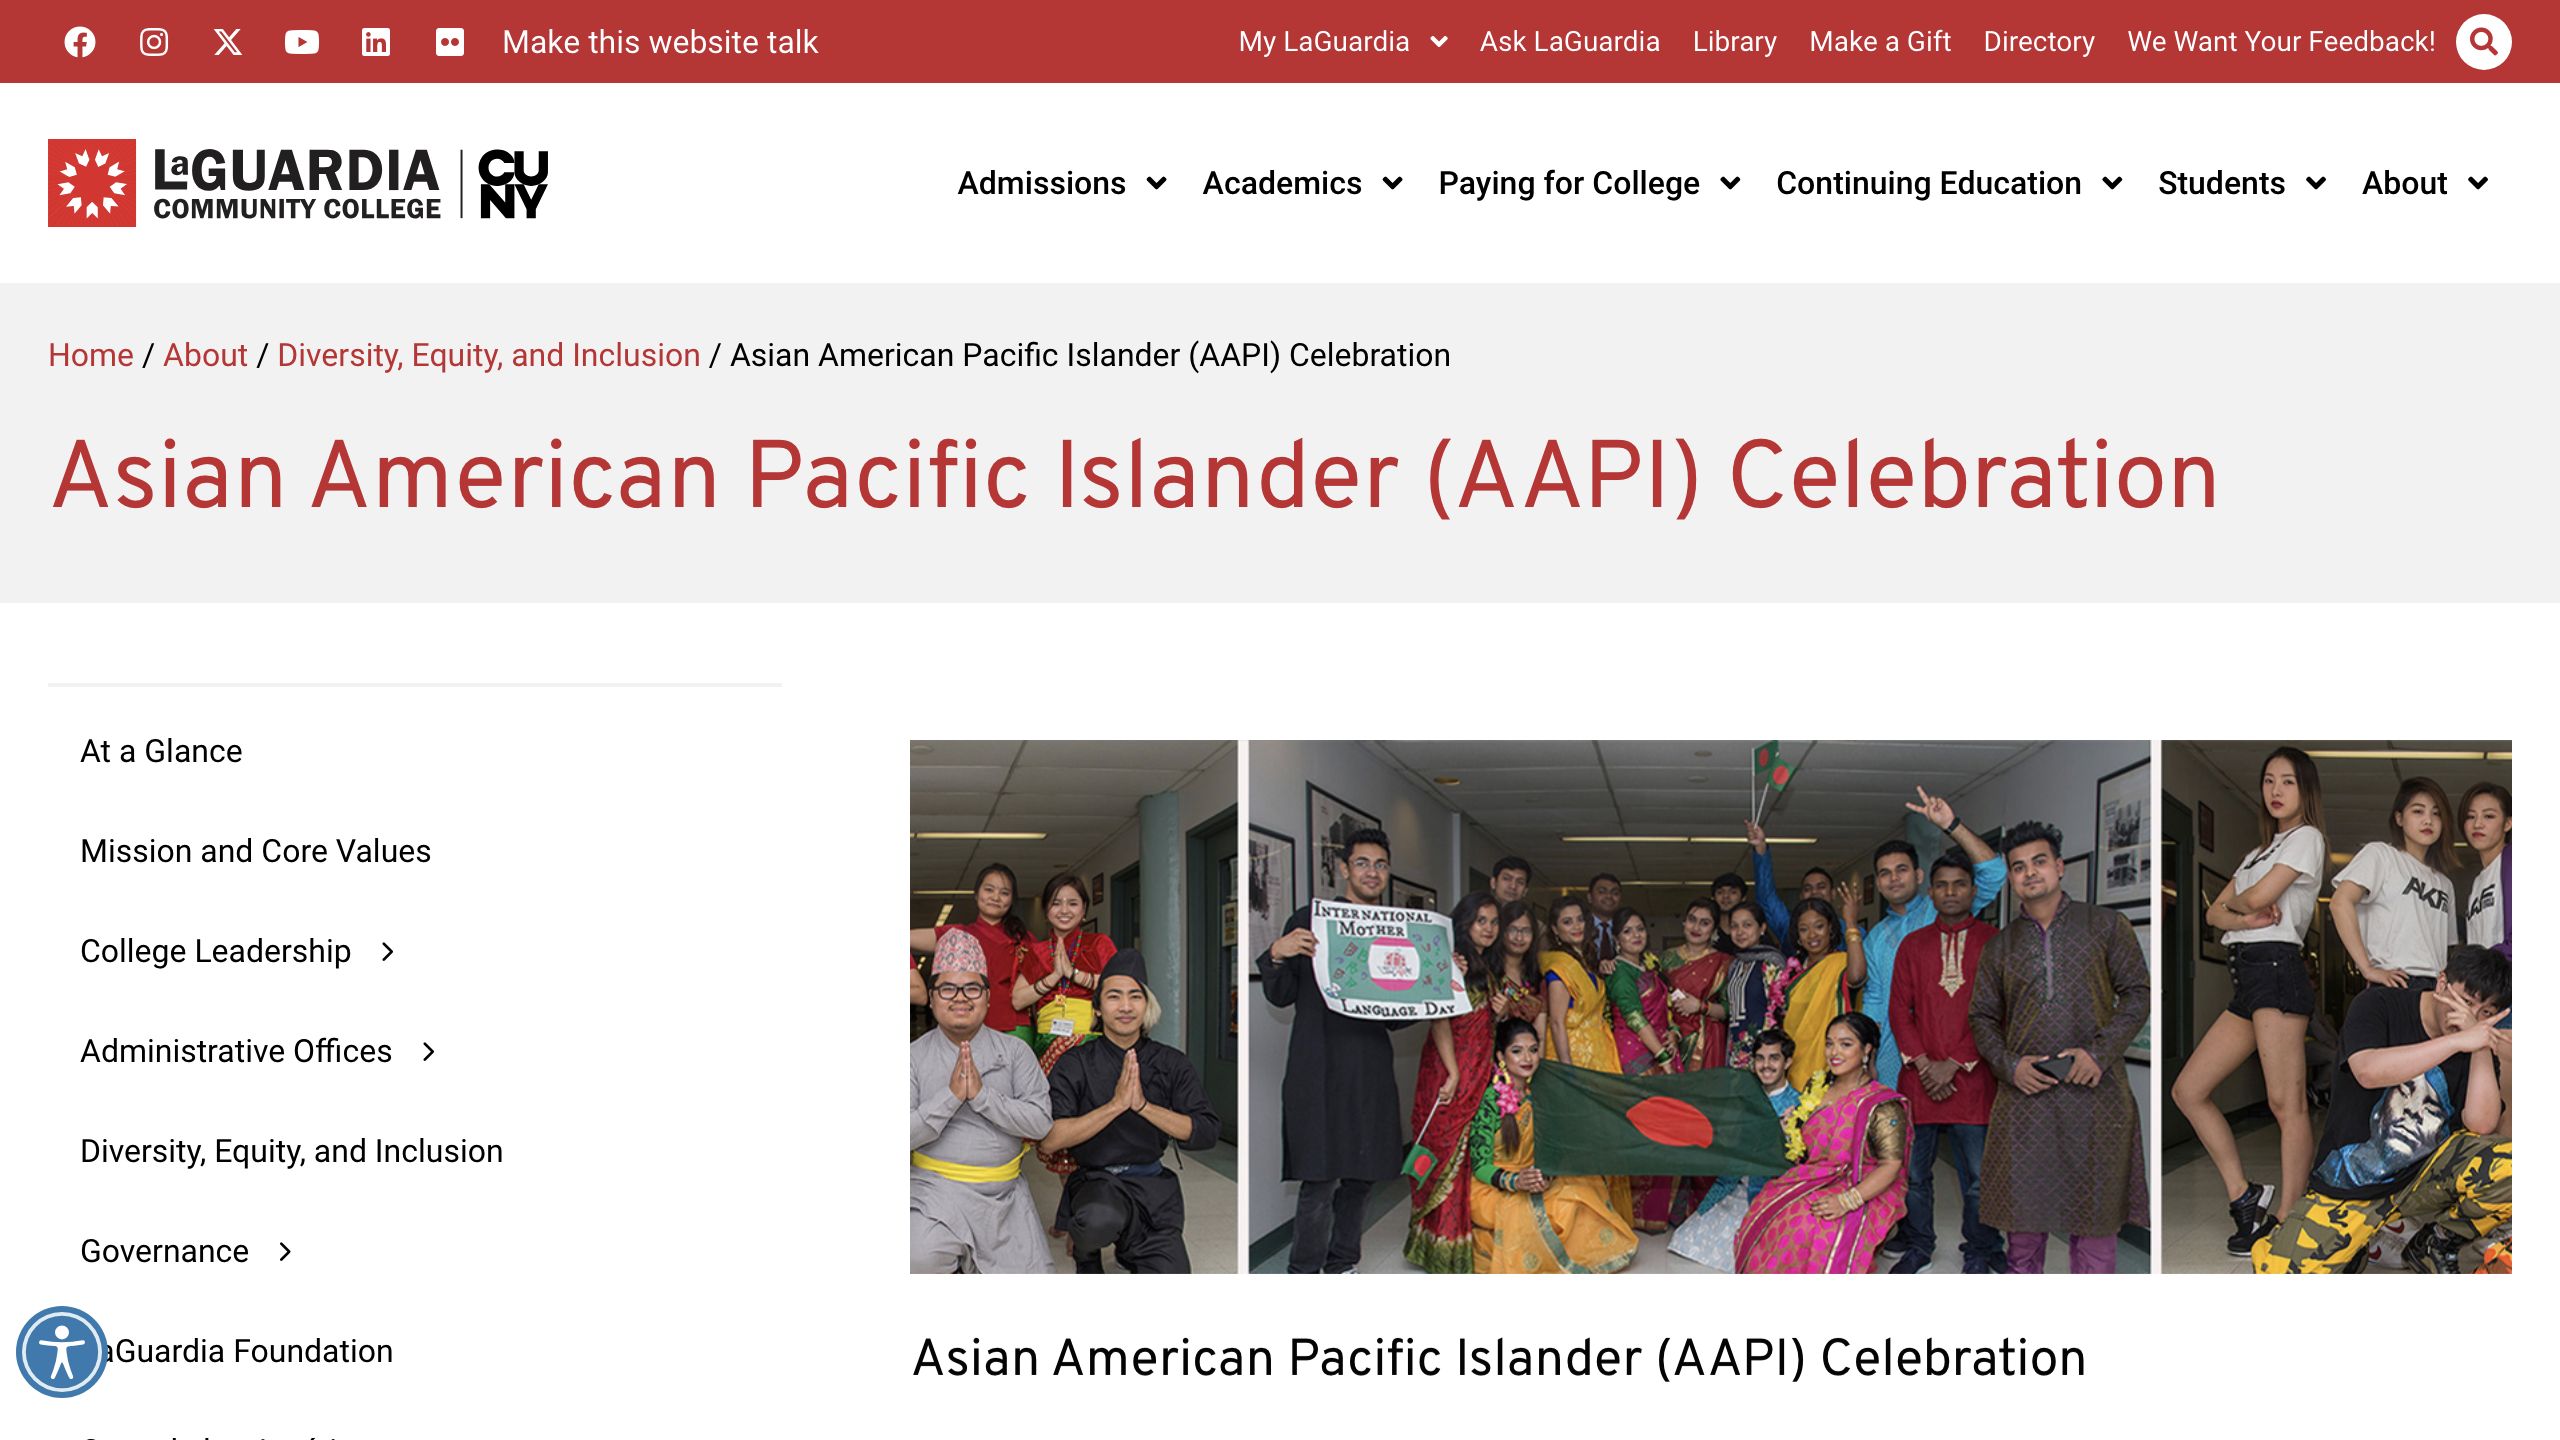
LaGuardia's AAPI Heritage Month
Asian American Voices
A brief history of the AAPI Heritage Month at LaGuardia
The planning committee for the AAPI Heritage Month hosts virtual/in-person meetings from December to May to plan the AAPI Heritage Month each year. AAPI Heritage Month uses an Outlook Distribution Group (email list) for regular communication. See information below if you are interested in joining the e-mail group.
- E-mail to lg-aapi@cuny907.onmicrosoft.com to send a message to the AAPI Heritage Month Committee.
- Click this link to join the Outlook e-mail distribution group for the AAPI Heritage Month Committee.: https://bit.ly/LG-AAPI-invitation
How to join the AAPI Heritage Month committee
AAPI Heritage Month e-mail list
AAPI Data at LaGuardia
Analyzing the CUNY OAREDA data
- Data sources
- Summary
- The total number of students (headcounts) at LaGuardia peaked in 2014, with a headcount of 20,231. The number has been declining since then, particularly after 2020 (probably due to the pandemic).
- The AAPI student population at LaGuardia has seen the largest increase in enrollment over the years. From 1990 to 2022, the number of AAPI students rose from 1,406 to 3,298, an increase of 1,892. Hispanic students also saw significant growth, with an increase of 1,772 during the same period. However, the increase of Hispanic students was not as large as that of AAPI students.
- In terms of proportions, AAPI students accounted for 25.2% of the total student headcount at LaGuardia in 2022. This proportion continued to increase even after 2020. While there was a decline in AAPI students after 2020, the rate of decline was not as steep as students from other racial/ethnic backgrounds. As a result, AAPI students are now more represented in the LaGuardia's student body in recent years.
- AAPI FTE at LaGuardia has also increased from 953 in 1990 to 2,238 FTE in 2022. (https://tabsoft.co/3Rft3jZ )
- See the full data and analysis at https://github.com/tnagano22/LaGuardiaAAPI2023
Student head-counts by race/ethnicity at LaGuardia Community College between 1990 and 2022
| Year | White | Hispanic | Black | Asian or Pacific Islander | American Indian or Native American | Total |
|---|---|---|---|---|---|---|
| 1990 | 1741 | 3395 | 2603 | 1406 | 25 | 9170 |
| 1991 | 1722 | 3600 | 2565 | 1494 | 18 | 9399 |
| 1992 | 1812 | 3711 | 2635 | 1589 | 15 | 9762 |
| 1993 | 2014 | 4004 | 2774 | 1681 | 18 | 10491 |
| 1994 | 2207 | 4227 | 2768 | 1777 | 25 | 11004 |
| 1995 | 2064 | 4244 | 2658 | 1709 | 20 | 10695 |
| 1996 | 2115 | 4573 | 2677 | 1704 | 14 | 11080 |
| 1997 | 2124 | 4465 | 2535 | 1780 | 21 | 10925 |
| 1998 | 2226 | 4387 | 2458 | 1973 | 14 | 11058 |
| 1999 | 2221 | 4435 | 2469 | 2138 | 19 | 11282 |
| 2000 | 2381 | 4558 | 2427 | 2383 | 29 | 11778 |
| 2001 | 2281 | 4431 | 2246 | 2446 | 22 | 11426 |
| 2002 | 2578 | 4934 | 2509 | 2563 | 15 | 12599 |
| 2003 | 2572 | 5089 | 2556 | 2539 | 12 | 12768 |
| 2004 | 2706 | 5374 | 2852 | 2643 | 17 | 13592 |
| 2005 | 2561 | 5232 | 3007 | 2664 | 25 | 13489 |
| 2006 | 2583 | 5419 | 3119 | 3041 | 23 | 14185 |
| 2007 | 2546 | 6032 | 3142 | 3412 | 49 | 15169 |
| 2008 | 2533 | 6143 | 3063 | 3771 | 30 | 15540 |
| 2009 | 2763 | 6857 | 3210 | 4148 | 50 | 17028 |
| 2010 | 2865 | 7223 | 3350 | 4067 | 64 | 17569 |
| 2011 | 2983 | 7554 | 3637 | 4374 | 75 | 18623 |
| 2012 | 3118 | 7964 | 3845 | 4300 | 60 | 19287 |
| 2013 | 2995 | 8402 | 4056 | 4245 | 75 | 19773 |
| 2014 | 2928 | 8611 | 4305 | 4315 | 72 | 20231 |
| 2015 | 2730 | 8537 | 4036 | 4211 | 68 | 19582 |
| 2016 | 2623 | 8602 | 3809 | 4353 | 69 | 19456 |
| 2017 | 2599 | 8496 | 3594 | 4616 | 68 | 19373 |
| 2018 | 2683 | 8180 | 3667 | 4699 | 71 | 19300 |
| 2019 | 2638 | 7705 | 3598 | 4536 | 78 | 18555 |
| 2020 | 2394 | 6862 | 3568 | 4073 | 74 | 16971 |
| 2021 | 2101 | 6014 | 3285 | 3467 | 52 | 14919 |
| 2022 | 1790 | 5167 | 2754 | 3298 | 55 | 13064 |
Student head-counts (proportion) by race/ethnicity at LaGuardia Community College between 1990 and 2022
| Year | White | Hispanic | Black | Asian or Pacific Islander | American Indian or Native American |
|---|---|---|---|---|---|
| 1990 | 18.99% | 37.02% | 28.39% | 15.33% | 0.27% |
| 1991 | 18.32% | 38.30% | 27.29% | 15.90% | 0.19% |
| 1992 | 18.56% | 38.01% | 26.99% | 16.28% | 0.15% |
| 1993 | 19.20% | 38.17% | 26.44% | 16.02% | 0.17% |
| 1994 | 20.06% | 38.41% | 25.15% | 16.15% | 0.23% |
| 1995 | 19.30% | 39.68% | 24.85% | 15.98% | 0.19% |
| 1996 | 19.08% | 41.26% | 24.15% | 15.37% | 0.13% |
| 1997 | 19.44% | 40.87% | 23.20% | 16.29% | 0.19% |
| 1998 | 20.13% | 39.67% | 22.23% | 17.84% | 0.13% |
| 1999 | 19.69% | 39.31% | 21.88% | 18.95% | 0.17% |
| 2000 | 20.22% | 38.70% | 20.61% | 20.23% | 0.25% |
| 2001 | 19.96% | 38.78% | 19.66% | 21.41% | 0.19% |
| 2002 | 20.46% | 39.16% | 19.91% | 20.34% | 0.12% |
| 2003 | 20.14% | 39.86% | 20.02% | 19.89% | 0.09% |
| 2004 | 19.91% | 39.54% | 20.98% | 19.45% | 0.13% |
| 2005 | 18.99% | 38.79% | 22.29% | 19.75% | 0.19% |
| 2006 | 18.21% | 38.20% | 21.99% | 21.44% | 0.16% |
| 2007 | 16.77% | 39.73% | 20.70% | 22.48% | 0.32% |
| 2008 | 16.30% | 39.53% | 19.71% | 24.27% | 0.19% |
| 2009 | 16.23% | 40.27% | 18.85% | 24.36% | 0.29% |
| 2010 | 16.31% | 41.11% | 19.07% | 23.15% | 0.36% |
| 2011 | 16.02% | 40.56% | 19.53% | 23.49% | 0.40% |
| 2012 | 16.17% | 41.29% | 19.94% | 22.29% | 0.31% |
| 2013 | 15.15% | 42.49% | 20.51% | 21.47% | 0.38% |
| 2014 | 14.47% | 42.56% | 21.28% | 21.33% | 0.36% |
| 2015 | 13.94% | 43.60% | 20.61% | 21.50% | 0.35% |
| 2016 | 13.48% | 44.21% | 19.58% | 22.37% | 0.35% |
| 2017 | 13.42% | 43.85% | 18.55% | 23.83% | 0.35% |
| 2018 | 13.90% | 42.38% | 19.00% | 24.35% | 0.37% |
| 2019 | 14.22% | 41.53% | 19.39% | 24.45% | 0.42% |
| 2020 | 14.11% | 40.43% | 21.02% | 24.00% | 0.44% |
| 2021 | 14.08% | 40.31% | 22.02% | 23.24% | 0.35% |
| 2022 | 13.70% | 39.55% | 21.08% | 25.24% | 0.42% |
Analyzing the CUNY Office of Recruitment and Diversity (ORD) data
- Data sources
- CUNY's Office of Recruitment and Diversity (ORD) https://www.cuny.edu/about/administration/offices/hr/recruitment-diversity/statistics-and-reports/
- "2020 to 2022 Three-Year Comparison of CUNY Workforce Demographics": https://www.cuny.edu/wp-content/uploads/sites/4/media-assets/3-Year-Comparison-2020-to-2022-CUNY-Workforce-Demographics-1.pdf
- Summary
- The representation of AAPI instructional staff in 2022 was only 16.6%, which slightly decreased from 16.9% in 2020. During the same time period, the AAPI student body at LaGuardia increased from 24.0% in 2020 to 25.5% in 2022.
- When looking at faculty data, which exclude full-time instructional employees without a faculty appointment, the representation of AAPI increases slightly to 18.4%. This is largely due to a lower representation of Hispanic instructional employees with faculty appointments, at just 13.1%.
- In terms of HEO titles (staff), only 14.2% of HEO titles were occupied by AAPI individuals in 2022. Again, the representation of AAPI staff has slightly decreased since 2020 when it was 15.2%. In contrast, other minority groups such as Hispanic (33%) and Black (25.4%) are better represented among the HEO titles.
- See the full data and analysis at https://github.com/tnagano22/LaGuardiaAAPI2023
The number of instructional staff (fulltime only) at LaGuardia Community College between 2020 and 2022 by race/ethnicty
| Year | White | Hispanic | Black | Asian or Pacific Islander | American Indian or Native American | Italian American | Two or More Races | sum |
|---|---|---|---|---|---|---|---|---|
| 2020 | 302 | 161 | 153 | 134 | 0 | 36 | 5 | 791 |
| 2021 | 279 | 159 | 140 | 128 | 0 | 34 | 5 | 745 |
| 2022 | 272 | 169 | 134 | 122 | 0 | 35 | 4 | 736 |
| Year | White | Hispanic | Black | Asian or Pacific Islander | American Indian or Native American | Italian American | Two or More Races |
|---|---|---|---|---|---|---|---|
| 2020 | 38.2% | 20.4% | 19.3% | 16.9% | 0.0% | 4.6% | 0.6% |
| 2021 | 37.4% | 21.3% | 18.8% | 17.2% | 0.0% | 4.6% | 0.7% |
| 2022 | 37.0% | 23.0% | 18.2% | 16.6% | 0.0% | 4.8% | 0.5% |
The number of faculty (fulltime only) at LaGuardia Community College between 2020 and 2022 by race/ethnicty
| Year | White | Hispanic | Black | Asian or Pacific Islander | American Indian or Native American | Italian American | Two or More Races | sum |
|---|---|---|---|---|---|---|---|---|
| 2020 | 196 | 43 | 52 | 71 | 0 | 19 | 2 | 383 |
| 2021 | 181 | 42 | 51 | 69 | 0 | 18 | 1 | 362 |
| 2022 | 188 | 49 | 49 | 69 | 0 | 19 | 1 | 375 |
| Year | White | Hispanic | Black | Asian or Pacific Islander | American Indian or Native American | Italian American | Two or More Races |
|---|---|---|---|---|---|---|---|
| 2020 | 51.2% | 11.2% | 13.6% | 18.5% | 0.0% | 5.0% | 0.5% |
| 2021 | 50.0% | 11.6% | 14.1% | 19.1% | 0.0% | 5.0% | 0.3% |
| 2022 | 50.1% | 13.1% | 13.1% | 18.4% | 0.0% | 5.1% | 0.3% |
The number of HEO (fulltime only) at LaGuardia Community College between 2020 and 2022 by race/ethnicty
| Year | White | Hispanic | Black | Asian or Pacific Islander | American Indian or Native American | Italian American | Two or More Races | sum |
|---|---|---|---|---|---|---|---|---|
| 2020 | 87 | 102 | 91 | 53 | 0 | 12 | 3 | 348 |
| 2021 | 81 | 100 | 79 | 49 | 0 | 11 | 4 | 324 |
| 2022 | 70 | 100 | 77 | 43 | 0 | 11 | 2 | 303 |
| Year | White | Hispanic | Black | Asian or Pacific Islander | American Indian or Native American | Italian American | Two or More Races |
|---|---|---|---|---|---|---|---|
| 2020 | 25.0% | 29.3% | 26.1% | 15.2% | 0.0% | 3.4% | 0.9% |
| 2021 | 25.0% | 30.9% | 24.4% | 15.1% | 0.0% | 3.4% | 1.2% |
| 2022 | 23.1% | 33.0% | 25.4% | 14.2% | 0.0% | 3.6% | 0.7% |
Other resources and links for AAPI data
- LaGuardia Community College Institutional Research: https://www.laguardia.edu/about/research-and-assessment/
- LaGuardia Community College Institutional Research (the Tableau site): https://public.tableau.com/app/profile/jenny.zhu/vizzes